代码审计PHPStorm断点调试
PHPStorm的调试环境
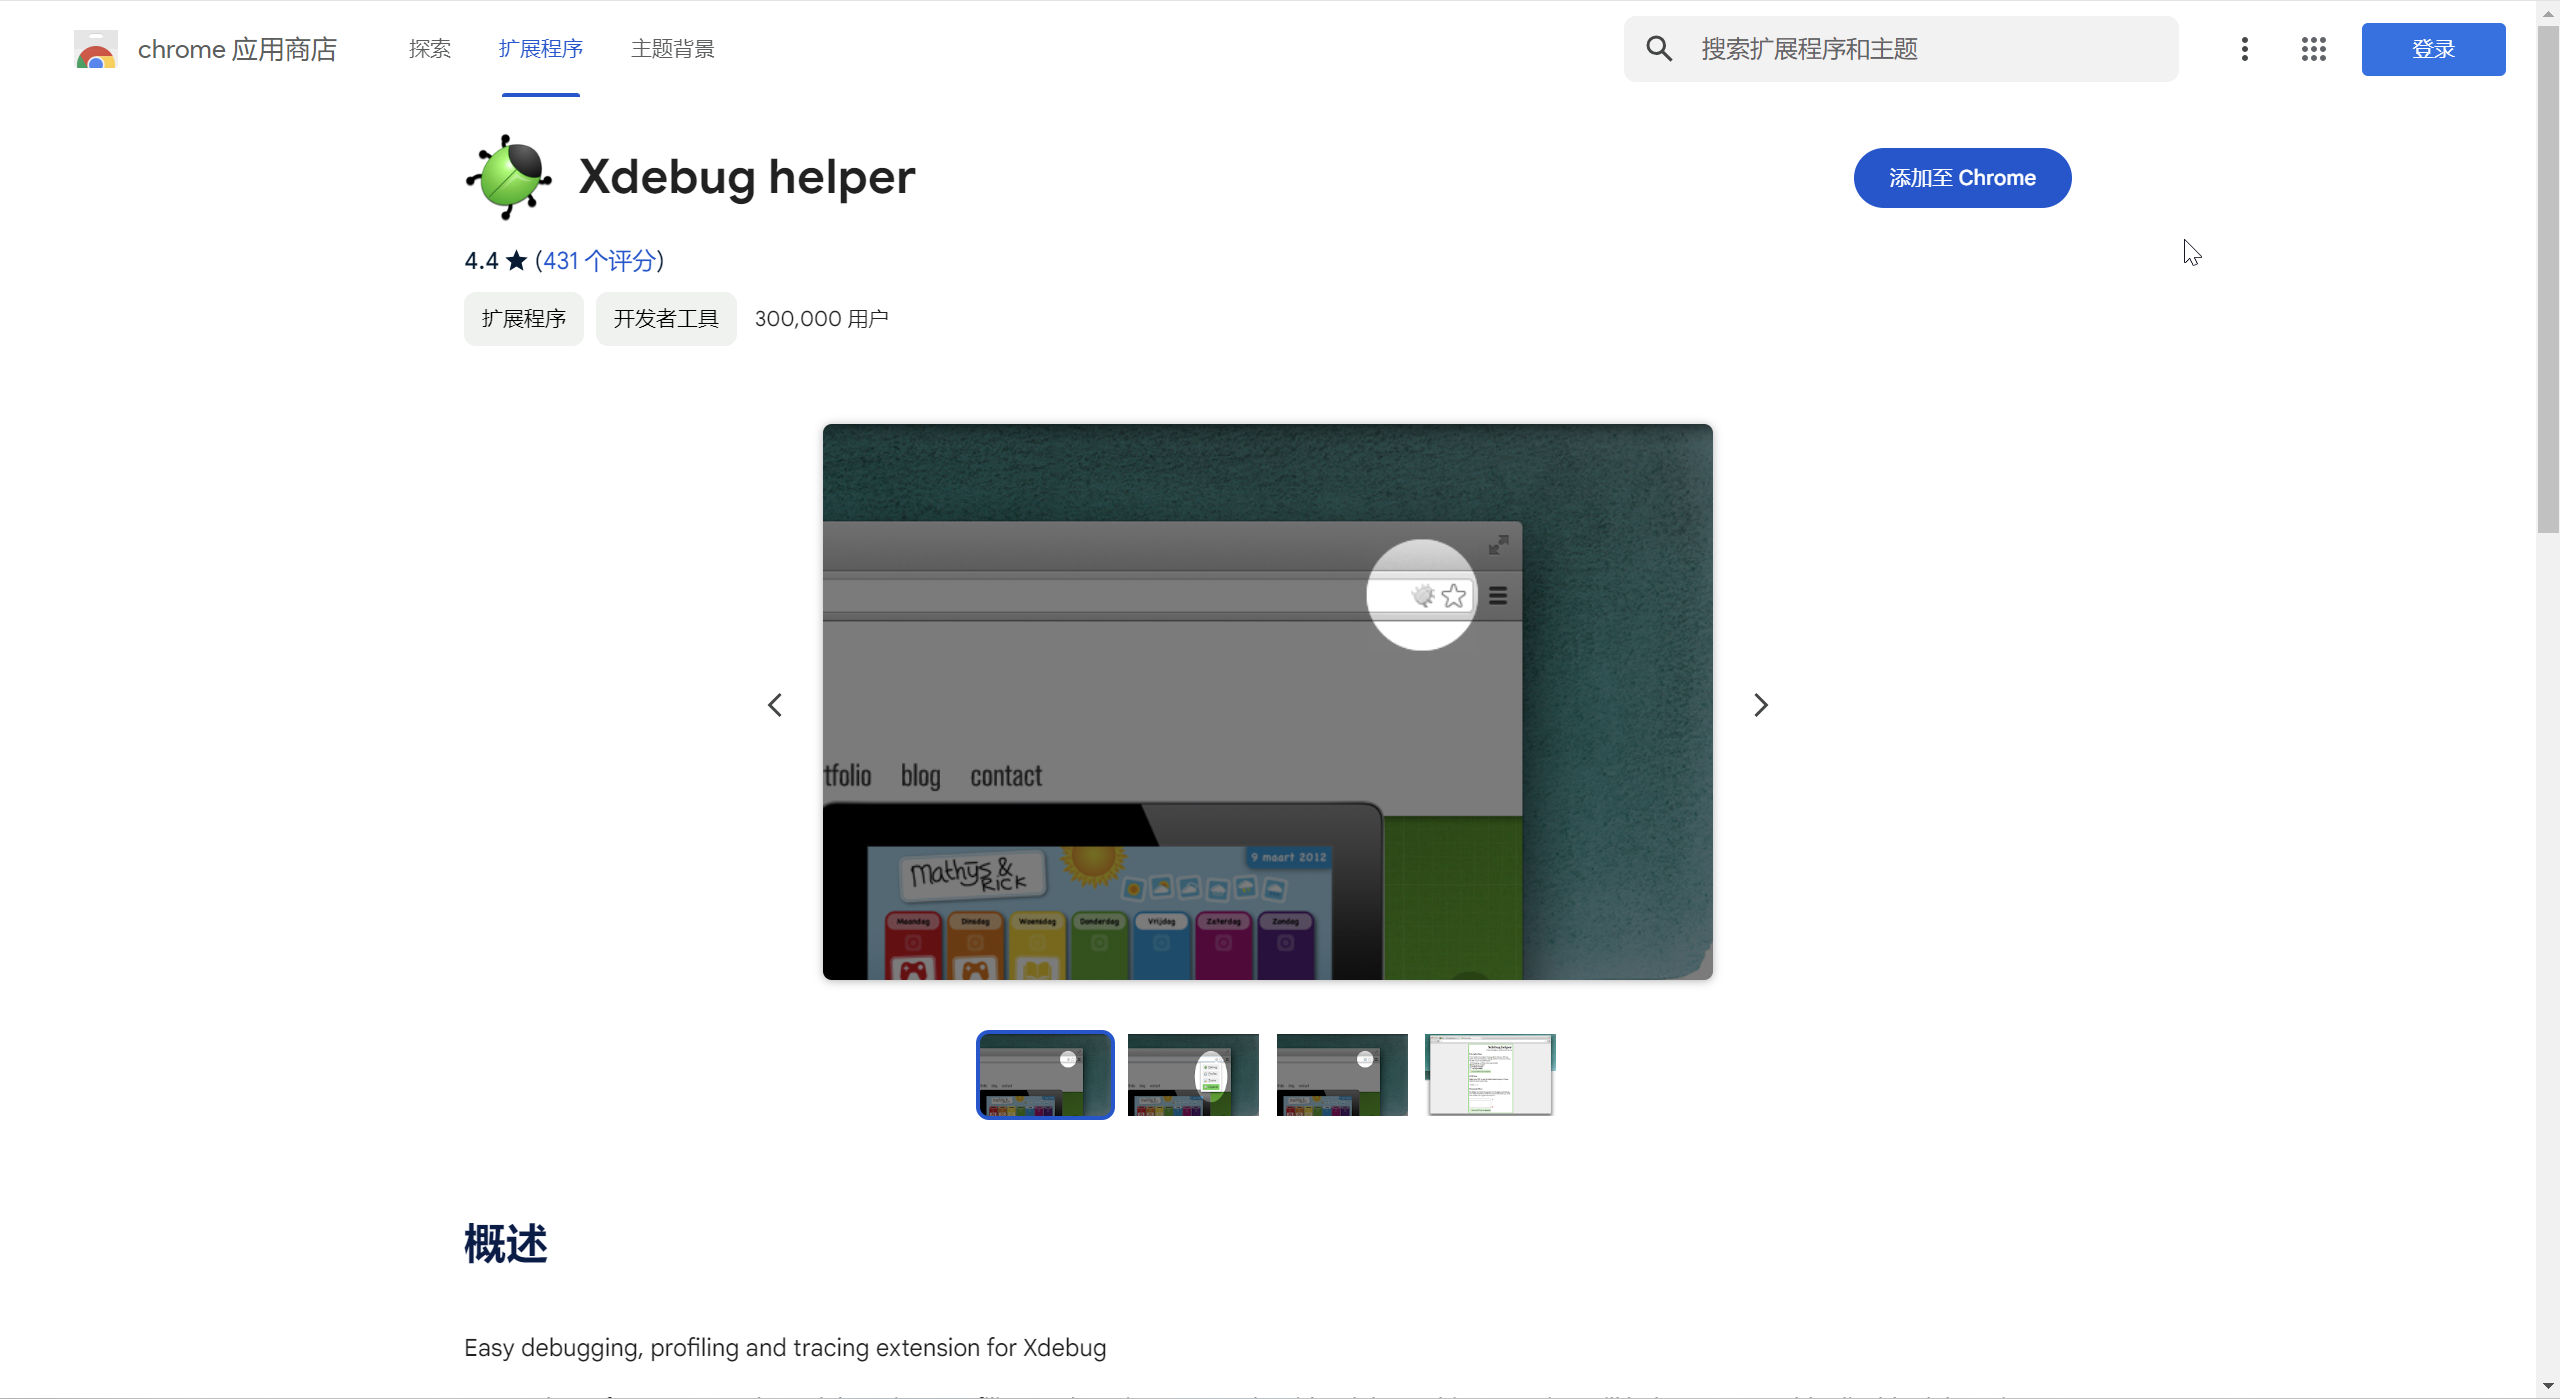
浏览器插件Xdebug helper
PhpStudy设置
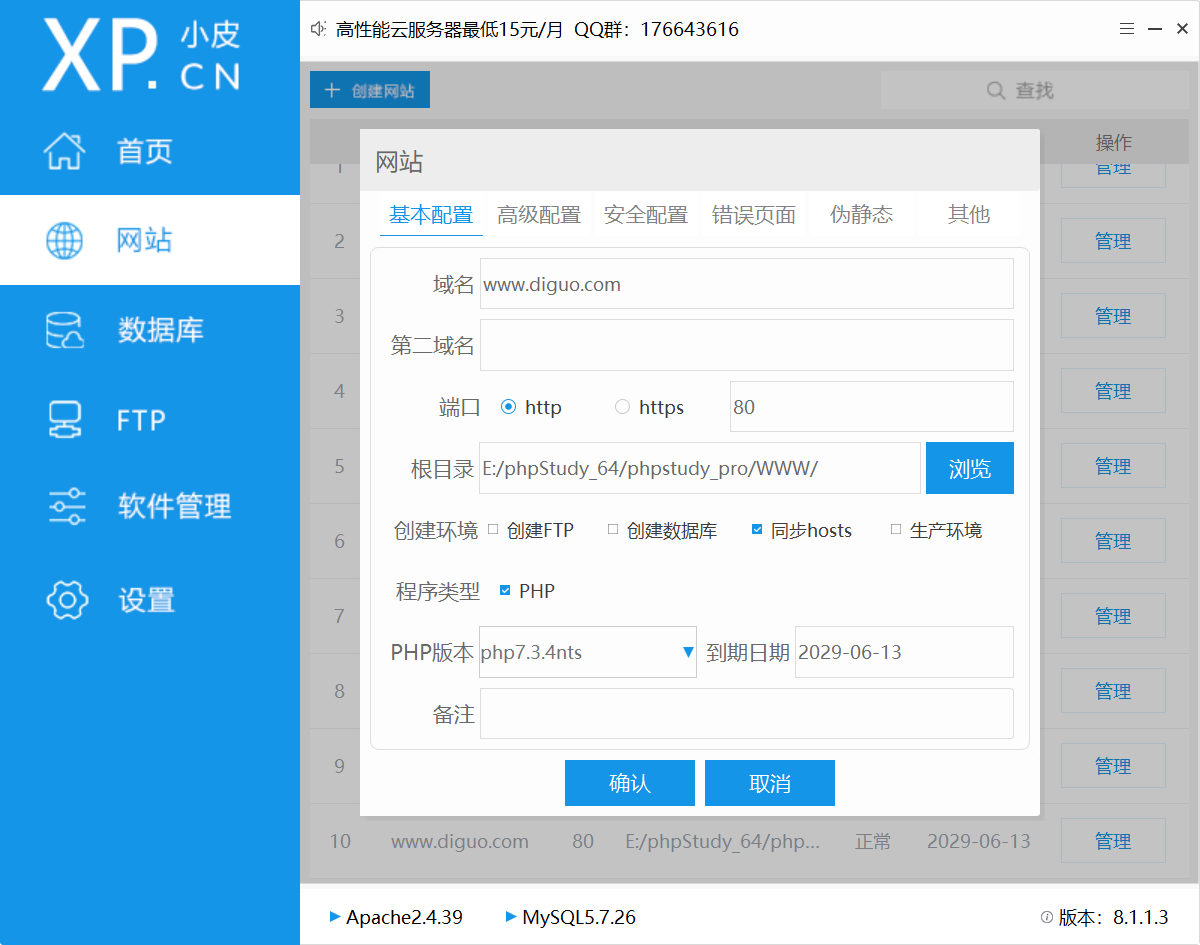
设置网站 设置PHP版本7.3
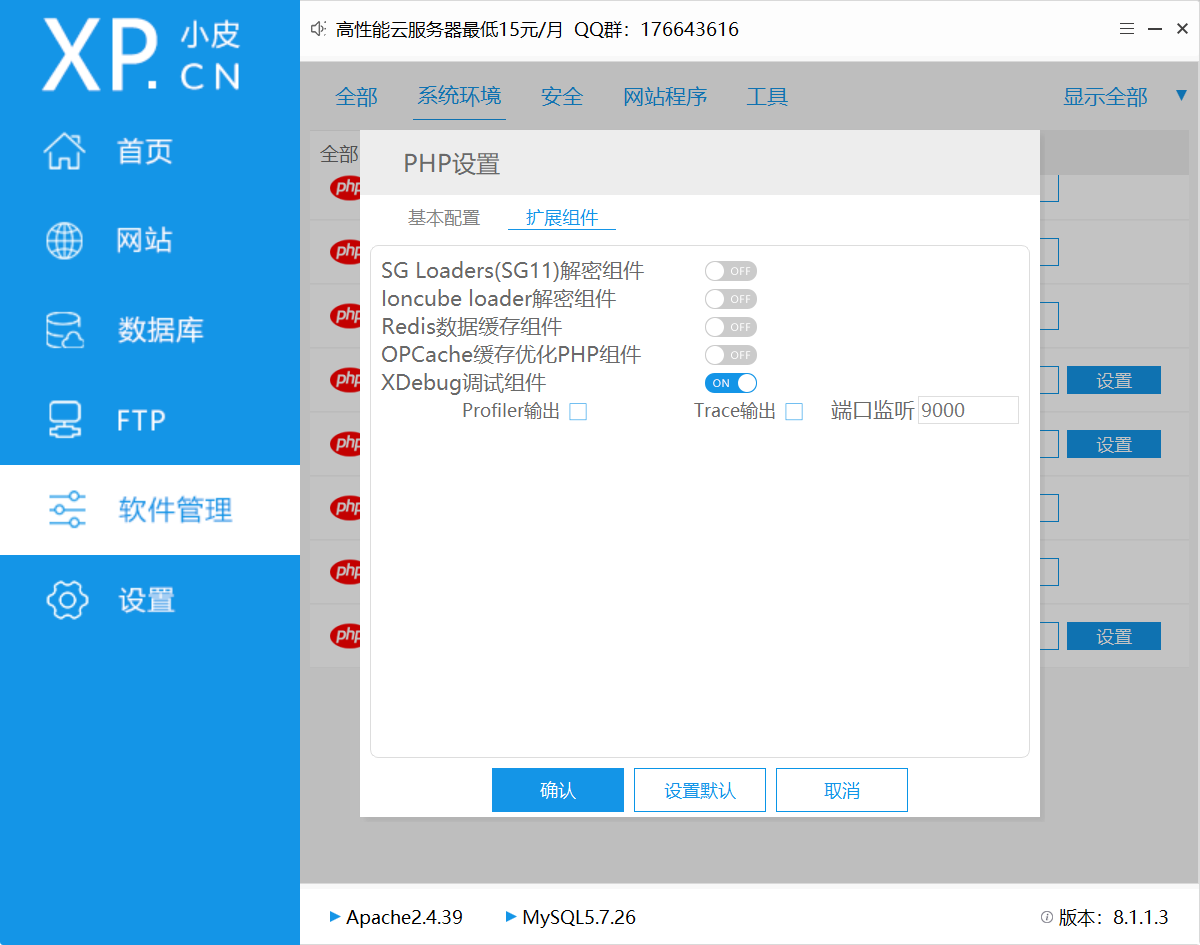
设置PHP拓展XDebug
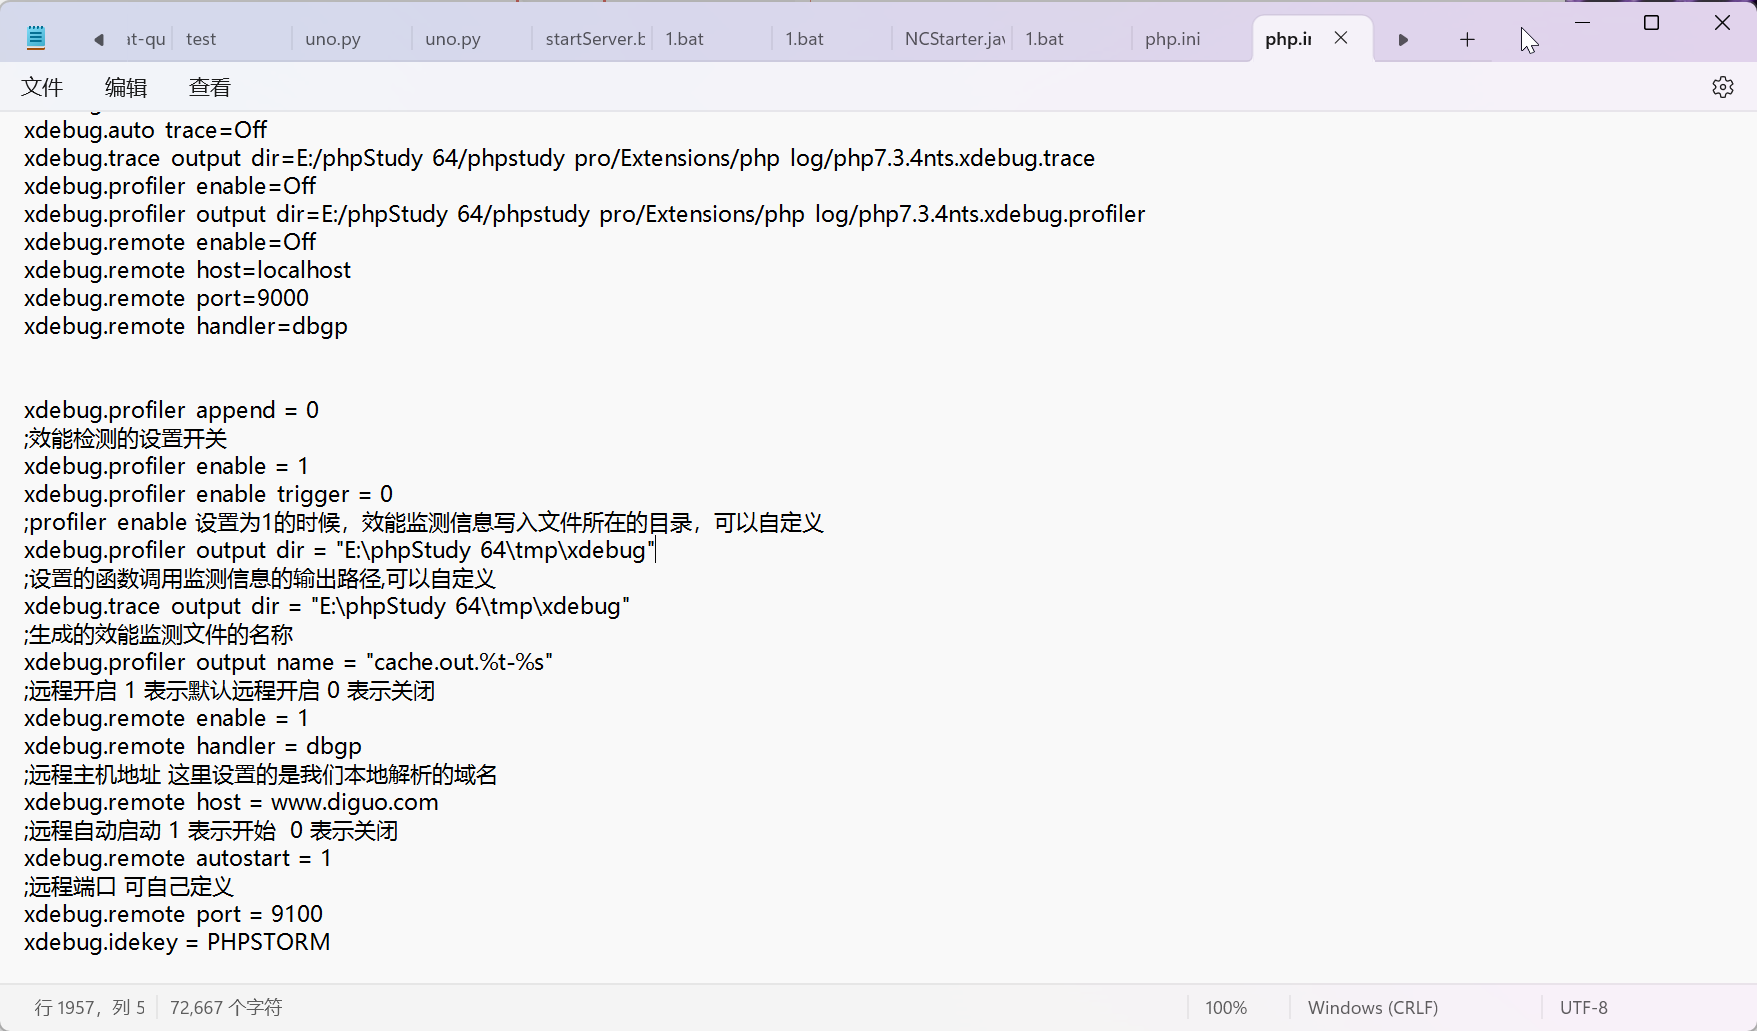
在php.ini结尾新增
1
2
3
4
5
6
7
8
9
10
11
12
13
14
15
16
17
18
19
20
| xdebug.profiler_append = 0
;效能检测的设置开关
xdebug.profiler_enable = 1
xdebug.profiler_enable_trigger = 0
;profiler_enable 设置为1的时候,效能监测信息写入文件所在的目录,可以自定义
xdebug.profiler_output_dir = "E:\phpStudy_64\tmp\xdebug"
;设置的函数调用监测信息的输出路径,可以自定义
xdebug.trace_output_dir = "E:\phpStudy_64\tmp\xdebug"
;生成的效能监测文件的名称
xdebug.profiler_output_name = "cache.out.%t-%s"
;远程开启 1 表示默认远程开启 0 表示关闭
xdebug.remote_enable = 1
xdebug.remote_handler = dbgp
;远程主机地址 这里设置的是我们本地解析的域名
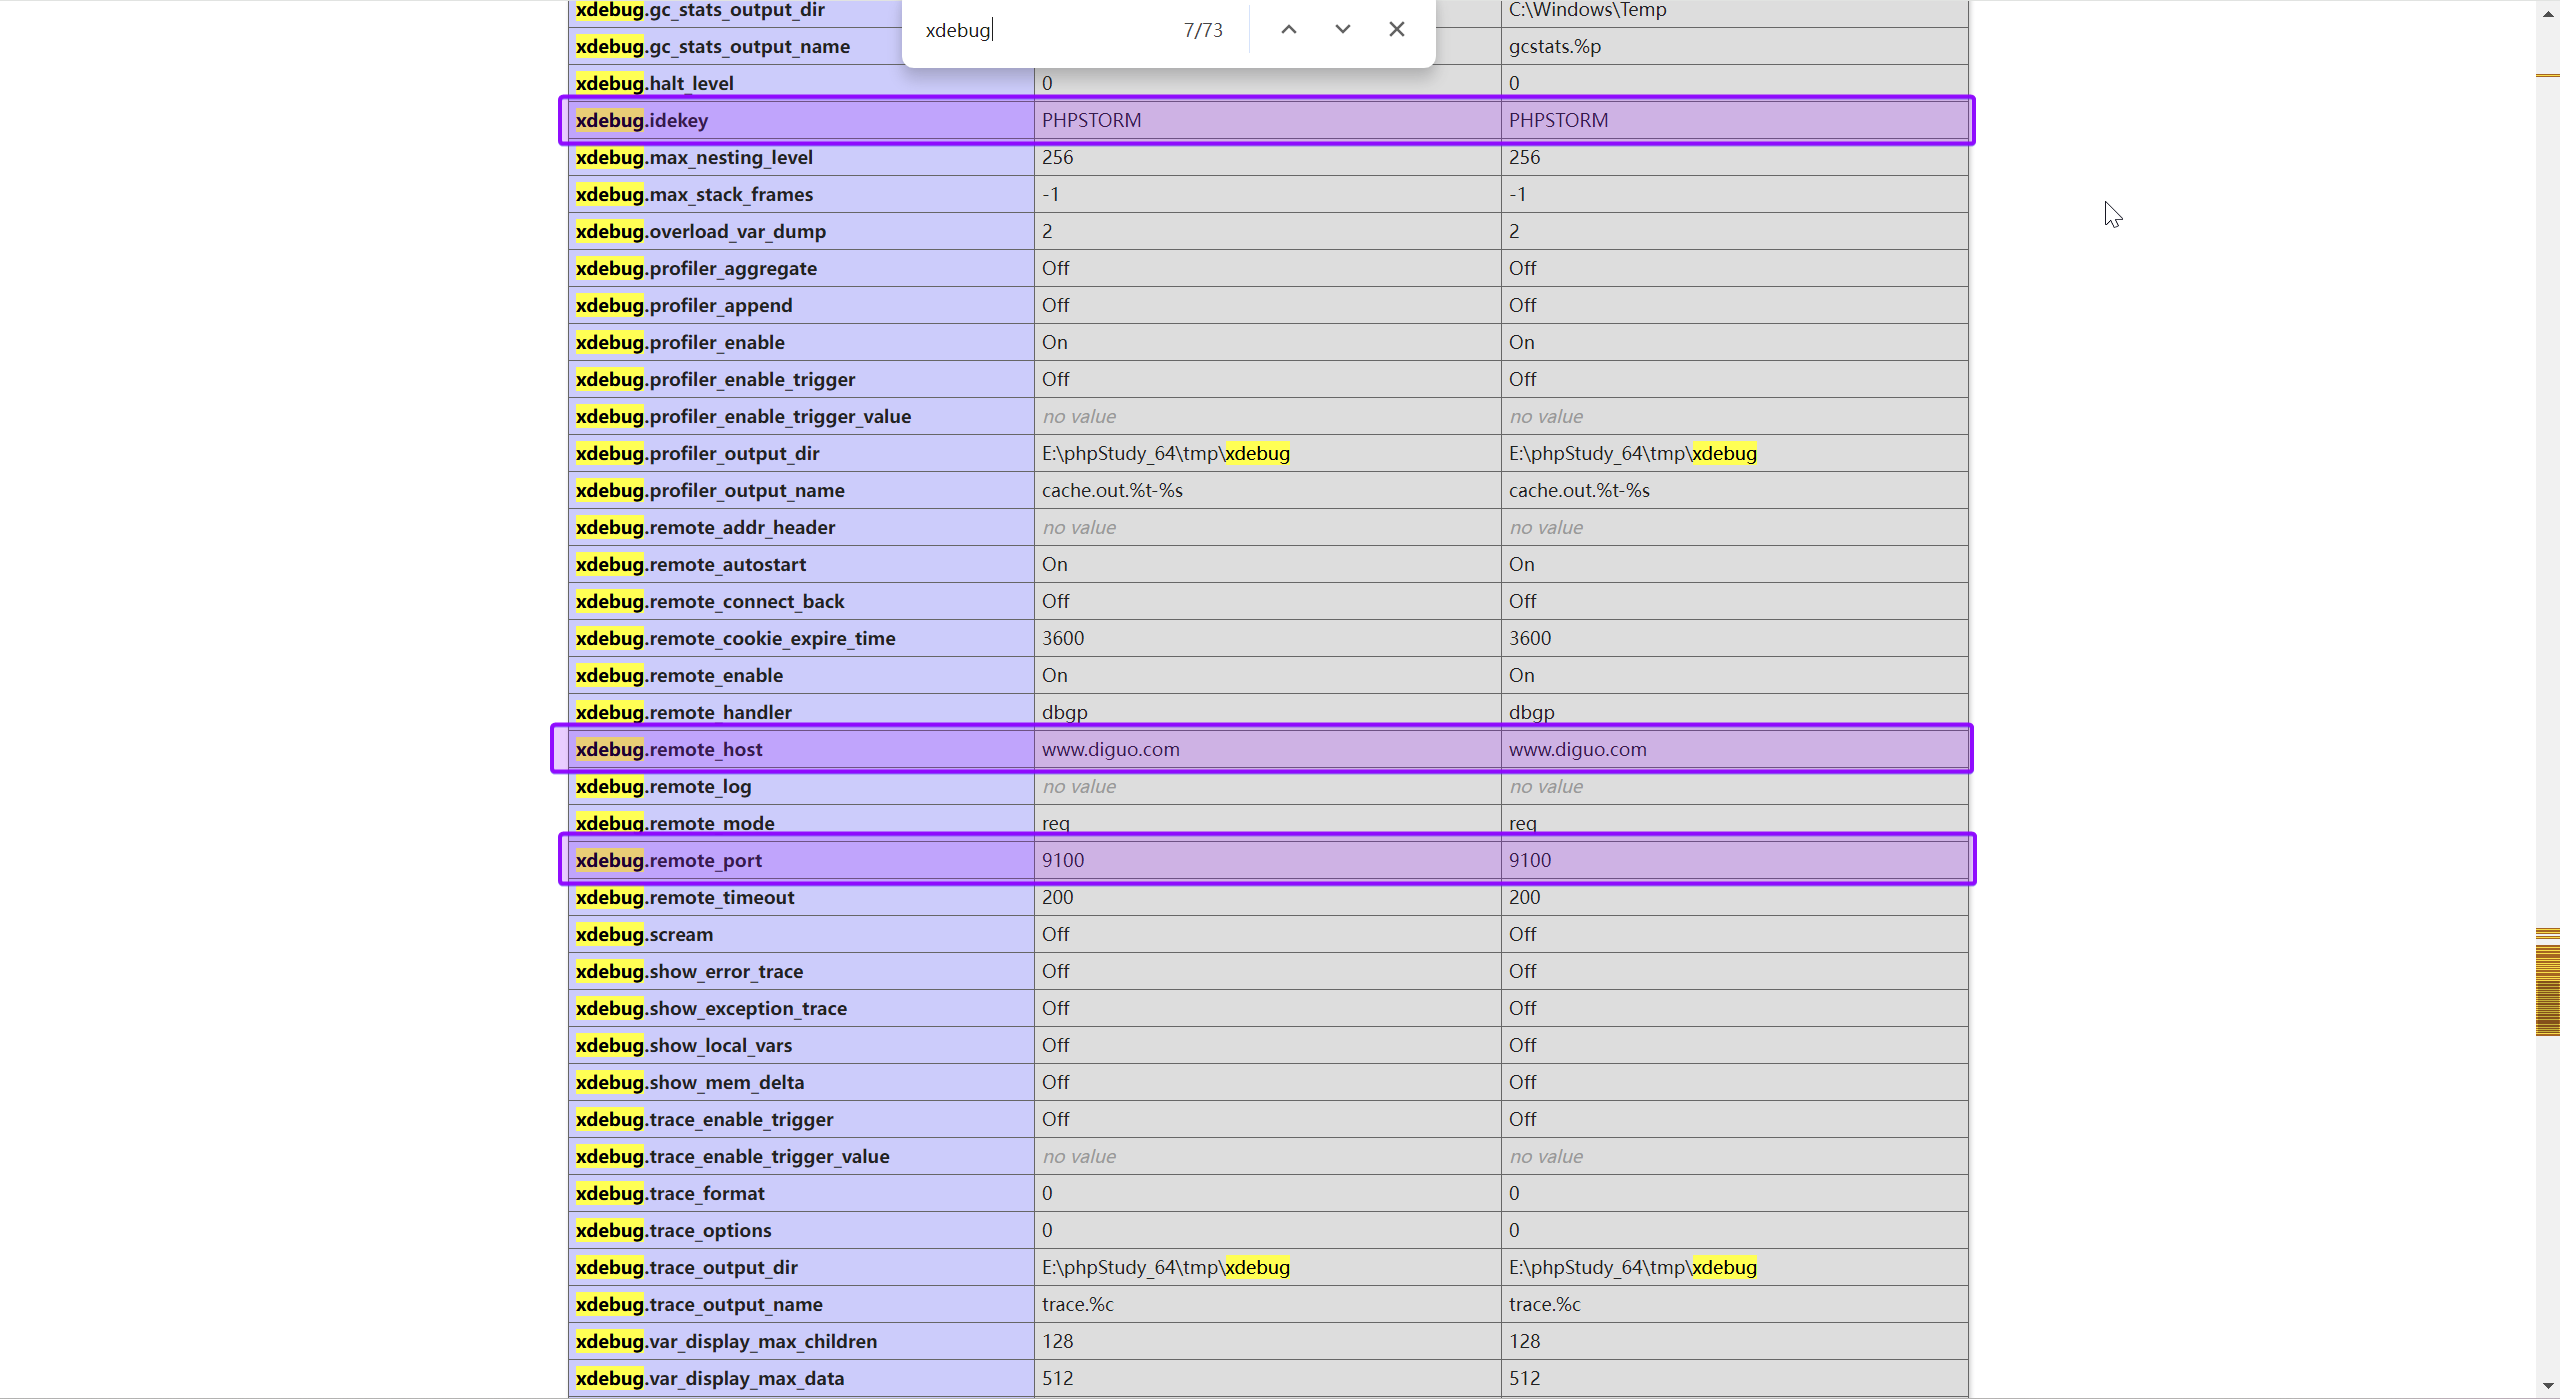
xdebug.remote_host = www.diguo.com
;远程自动启动 1 表示开始 0 表示关闭
xdebug.remote_autostart = 1
;远程端口 可自己定义
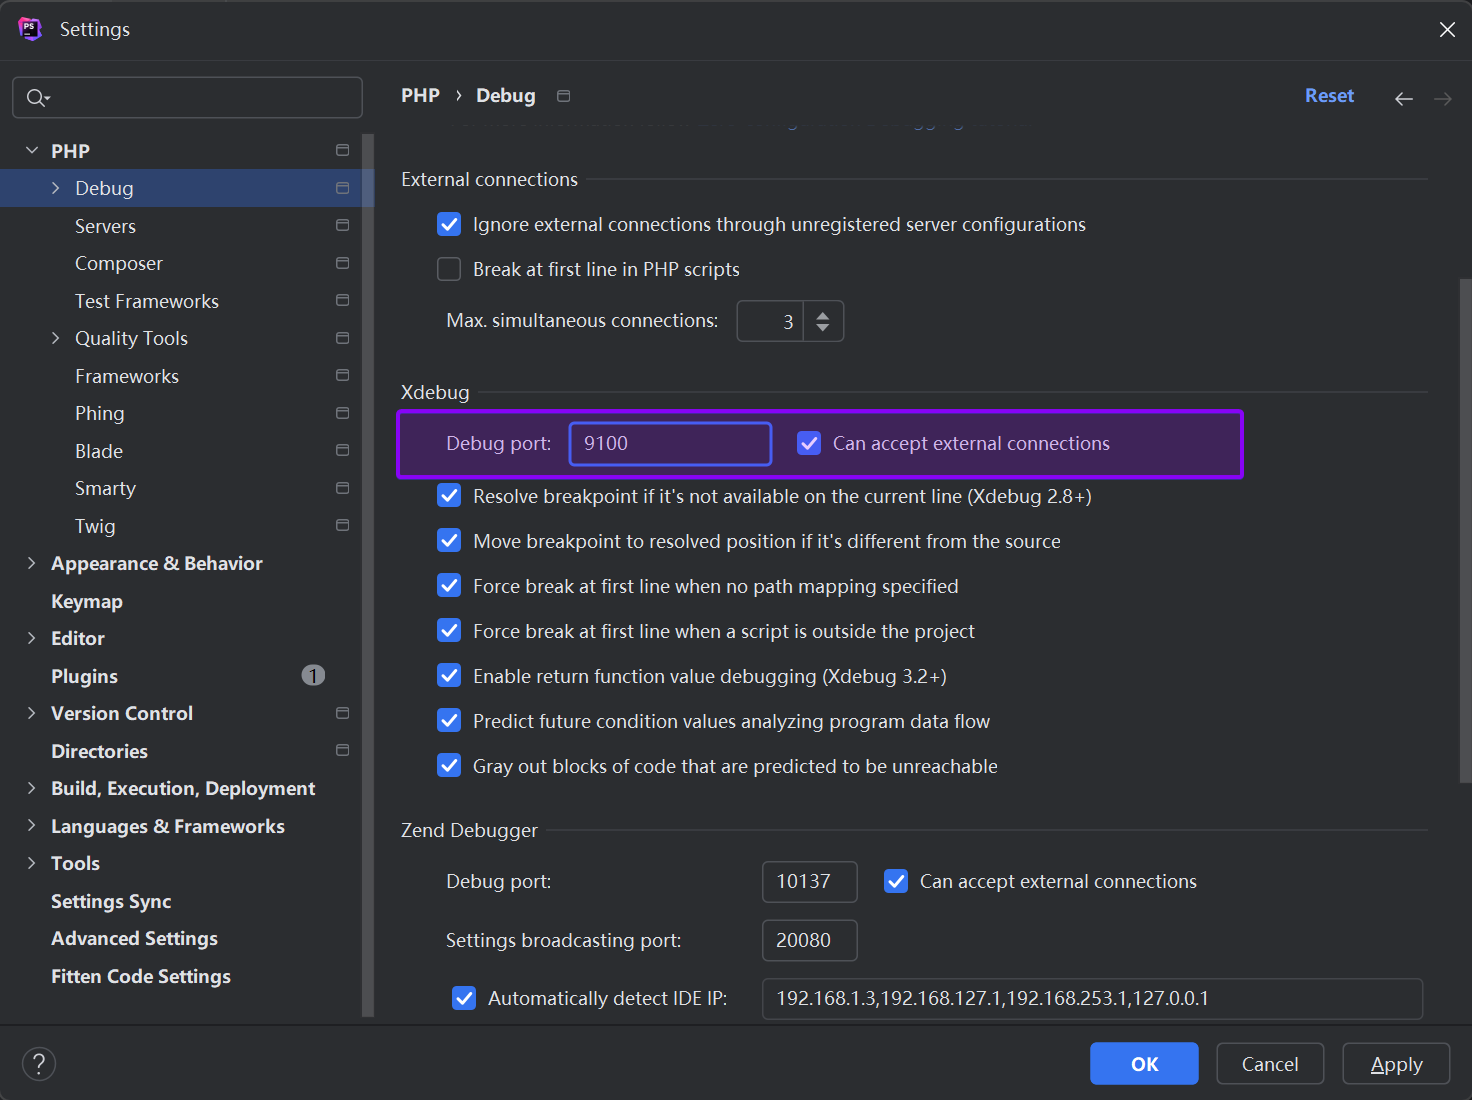
xdebug.remote_port = 9100
xdebug.idekey = PHPSTORM
|
查看phpinfo
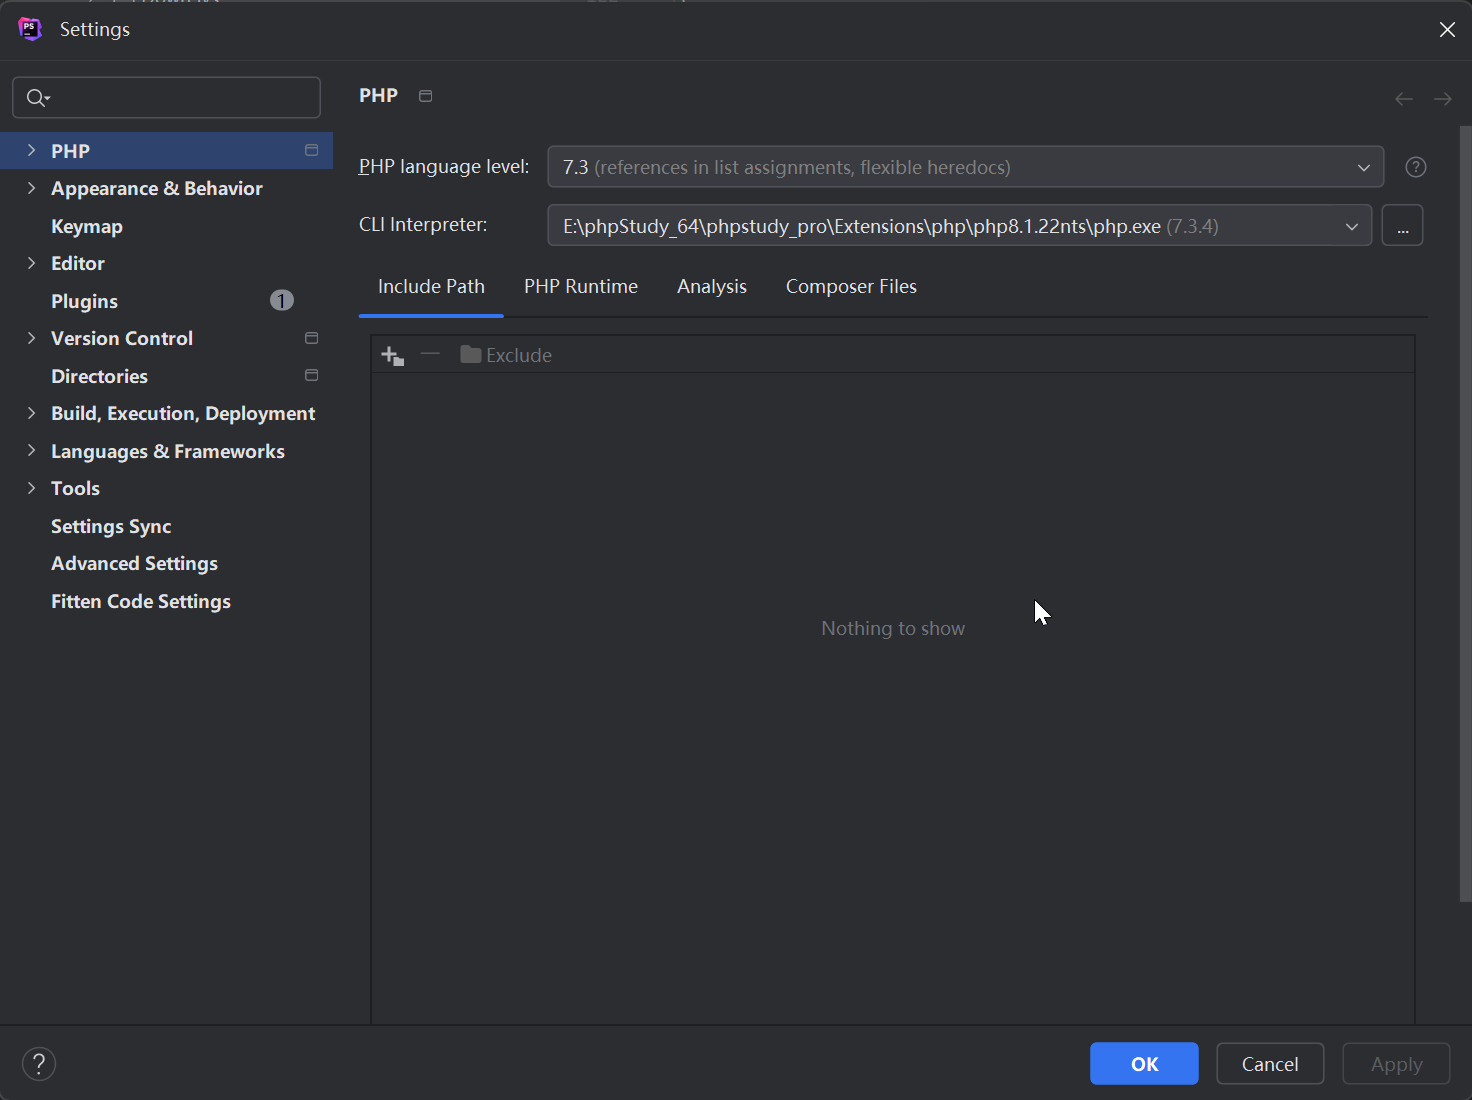
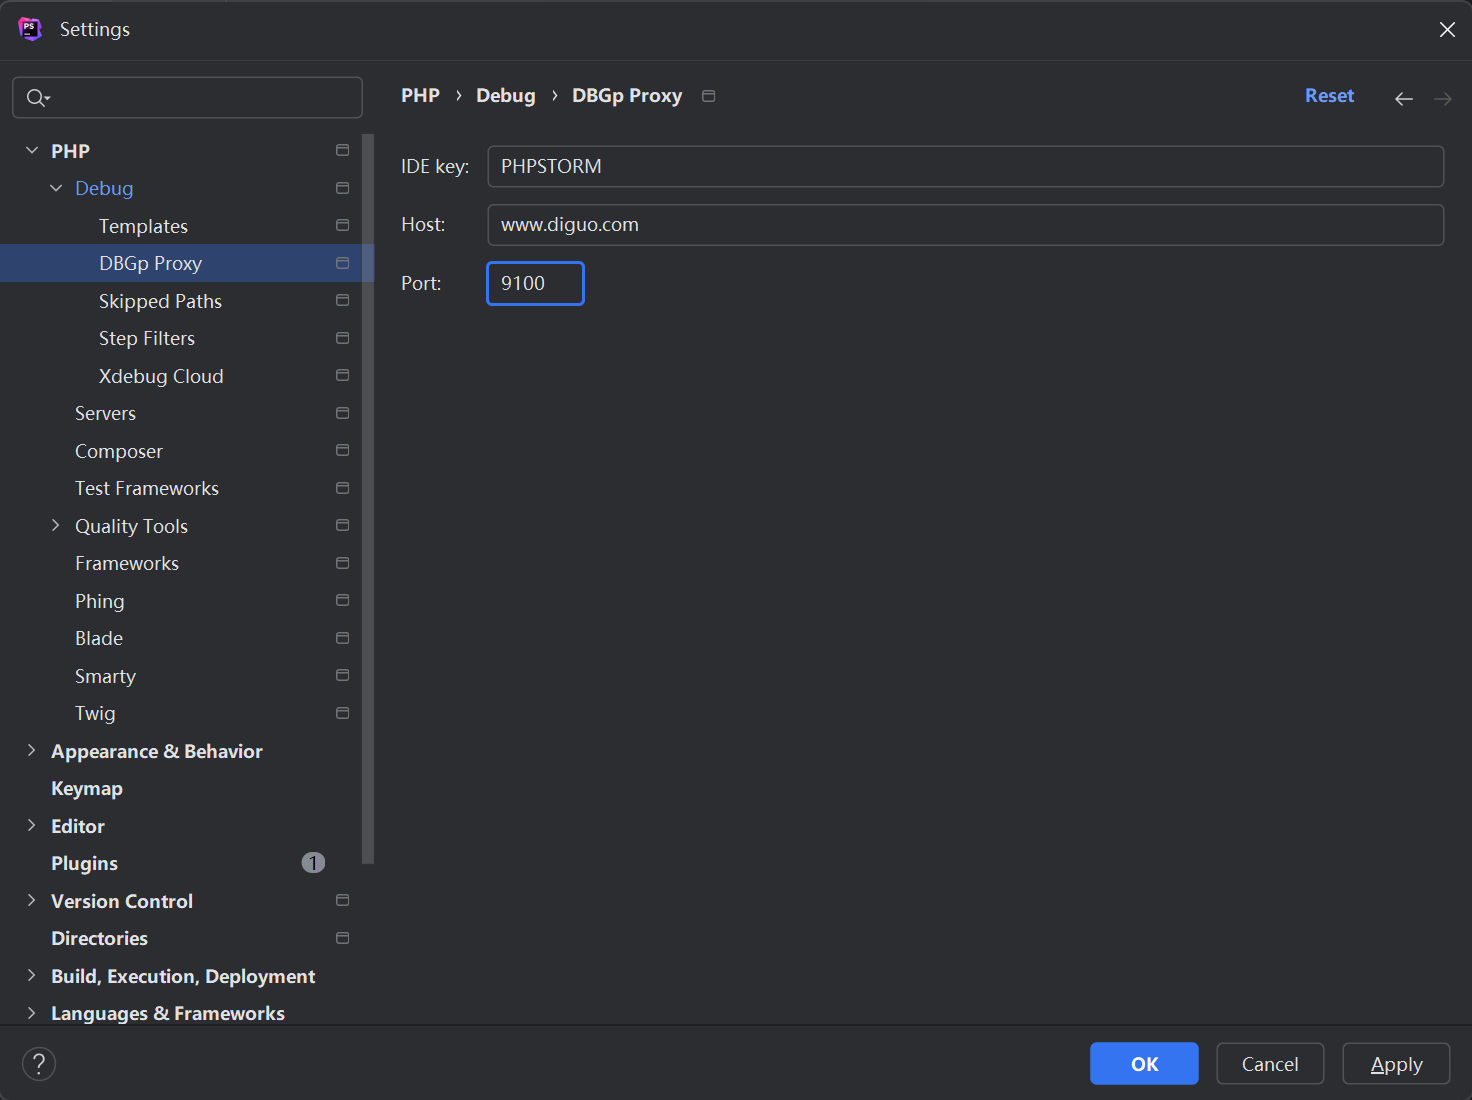
PHPStorm设置
php版本对应
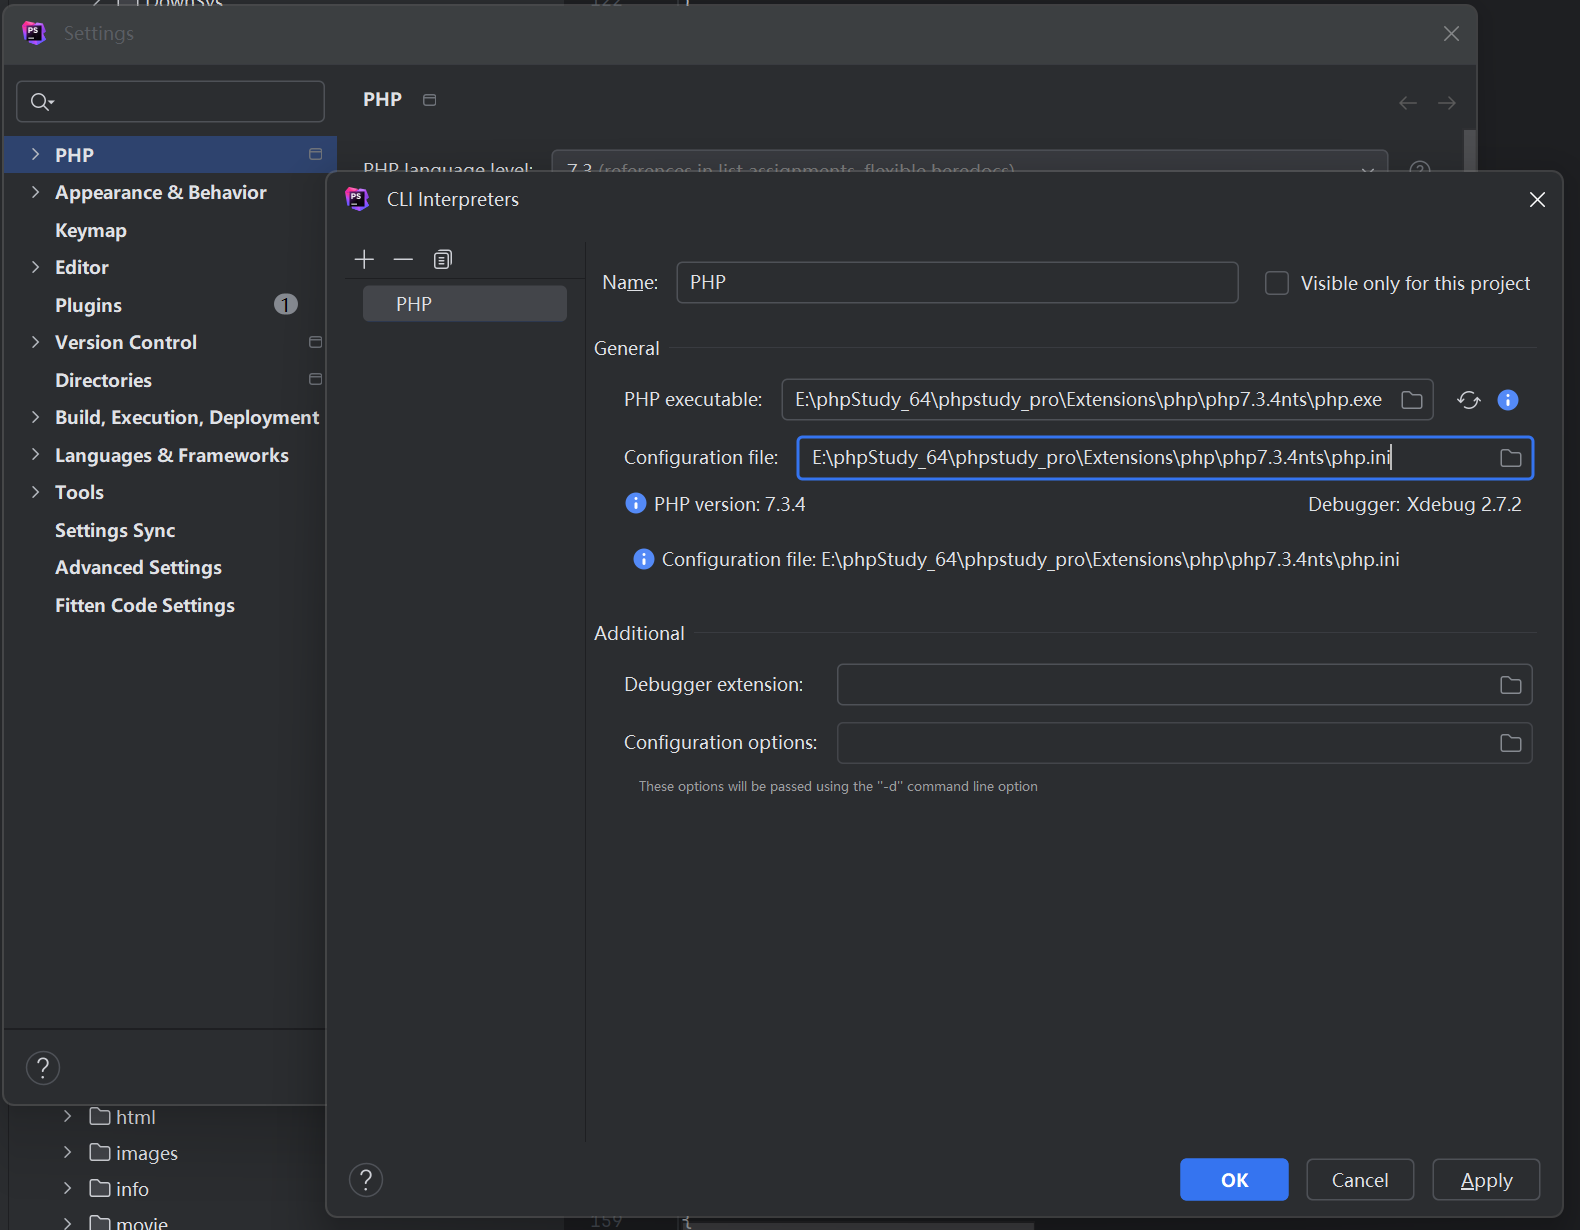
xdebug配置,对应php.ini phpinfo配置
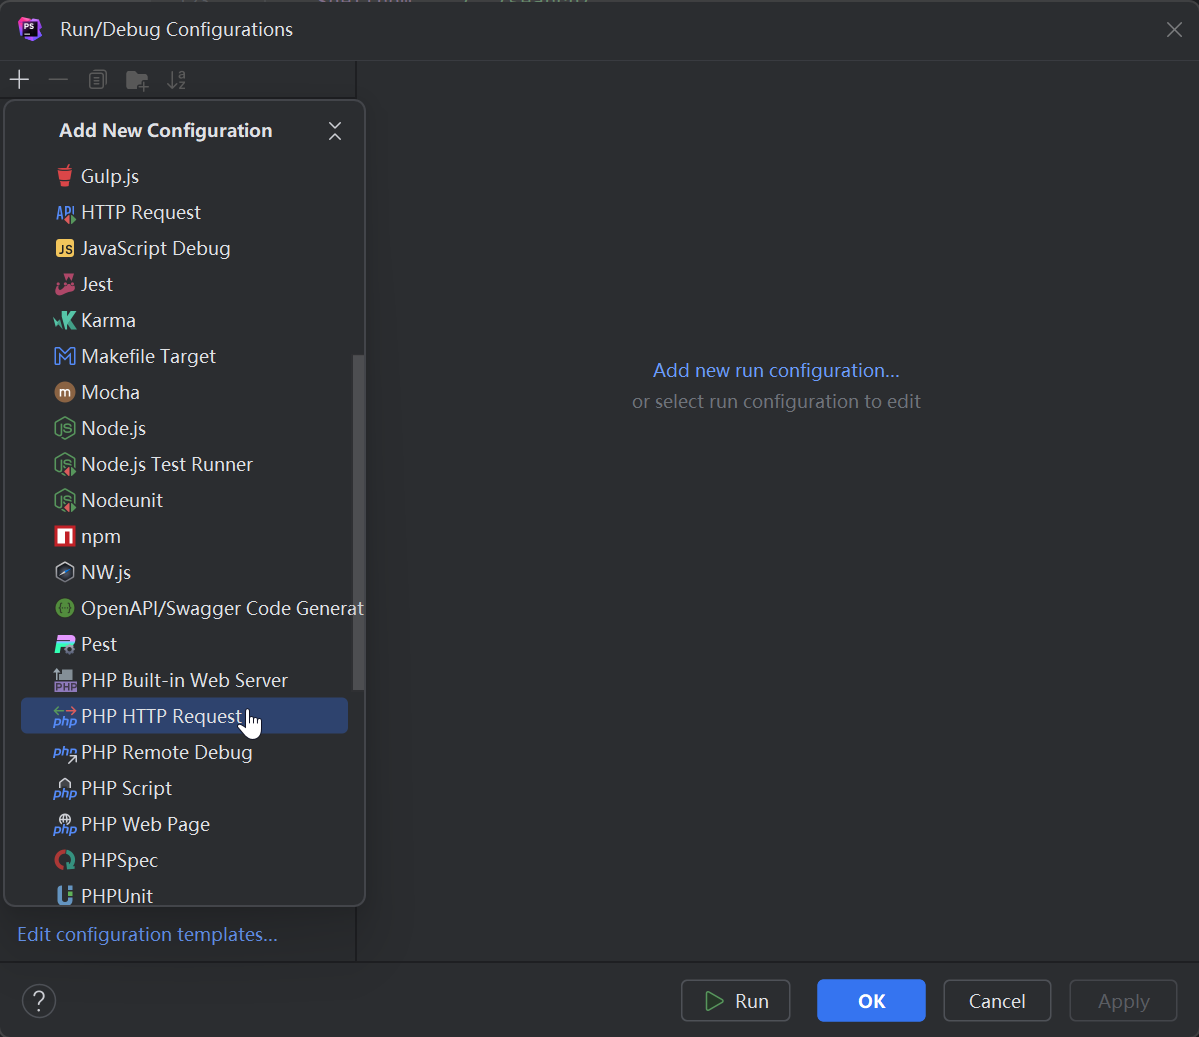
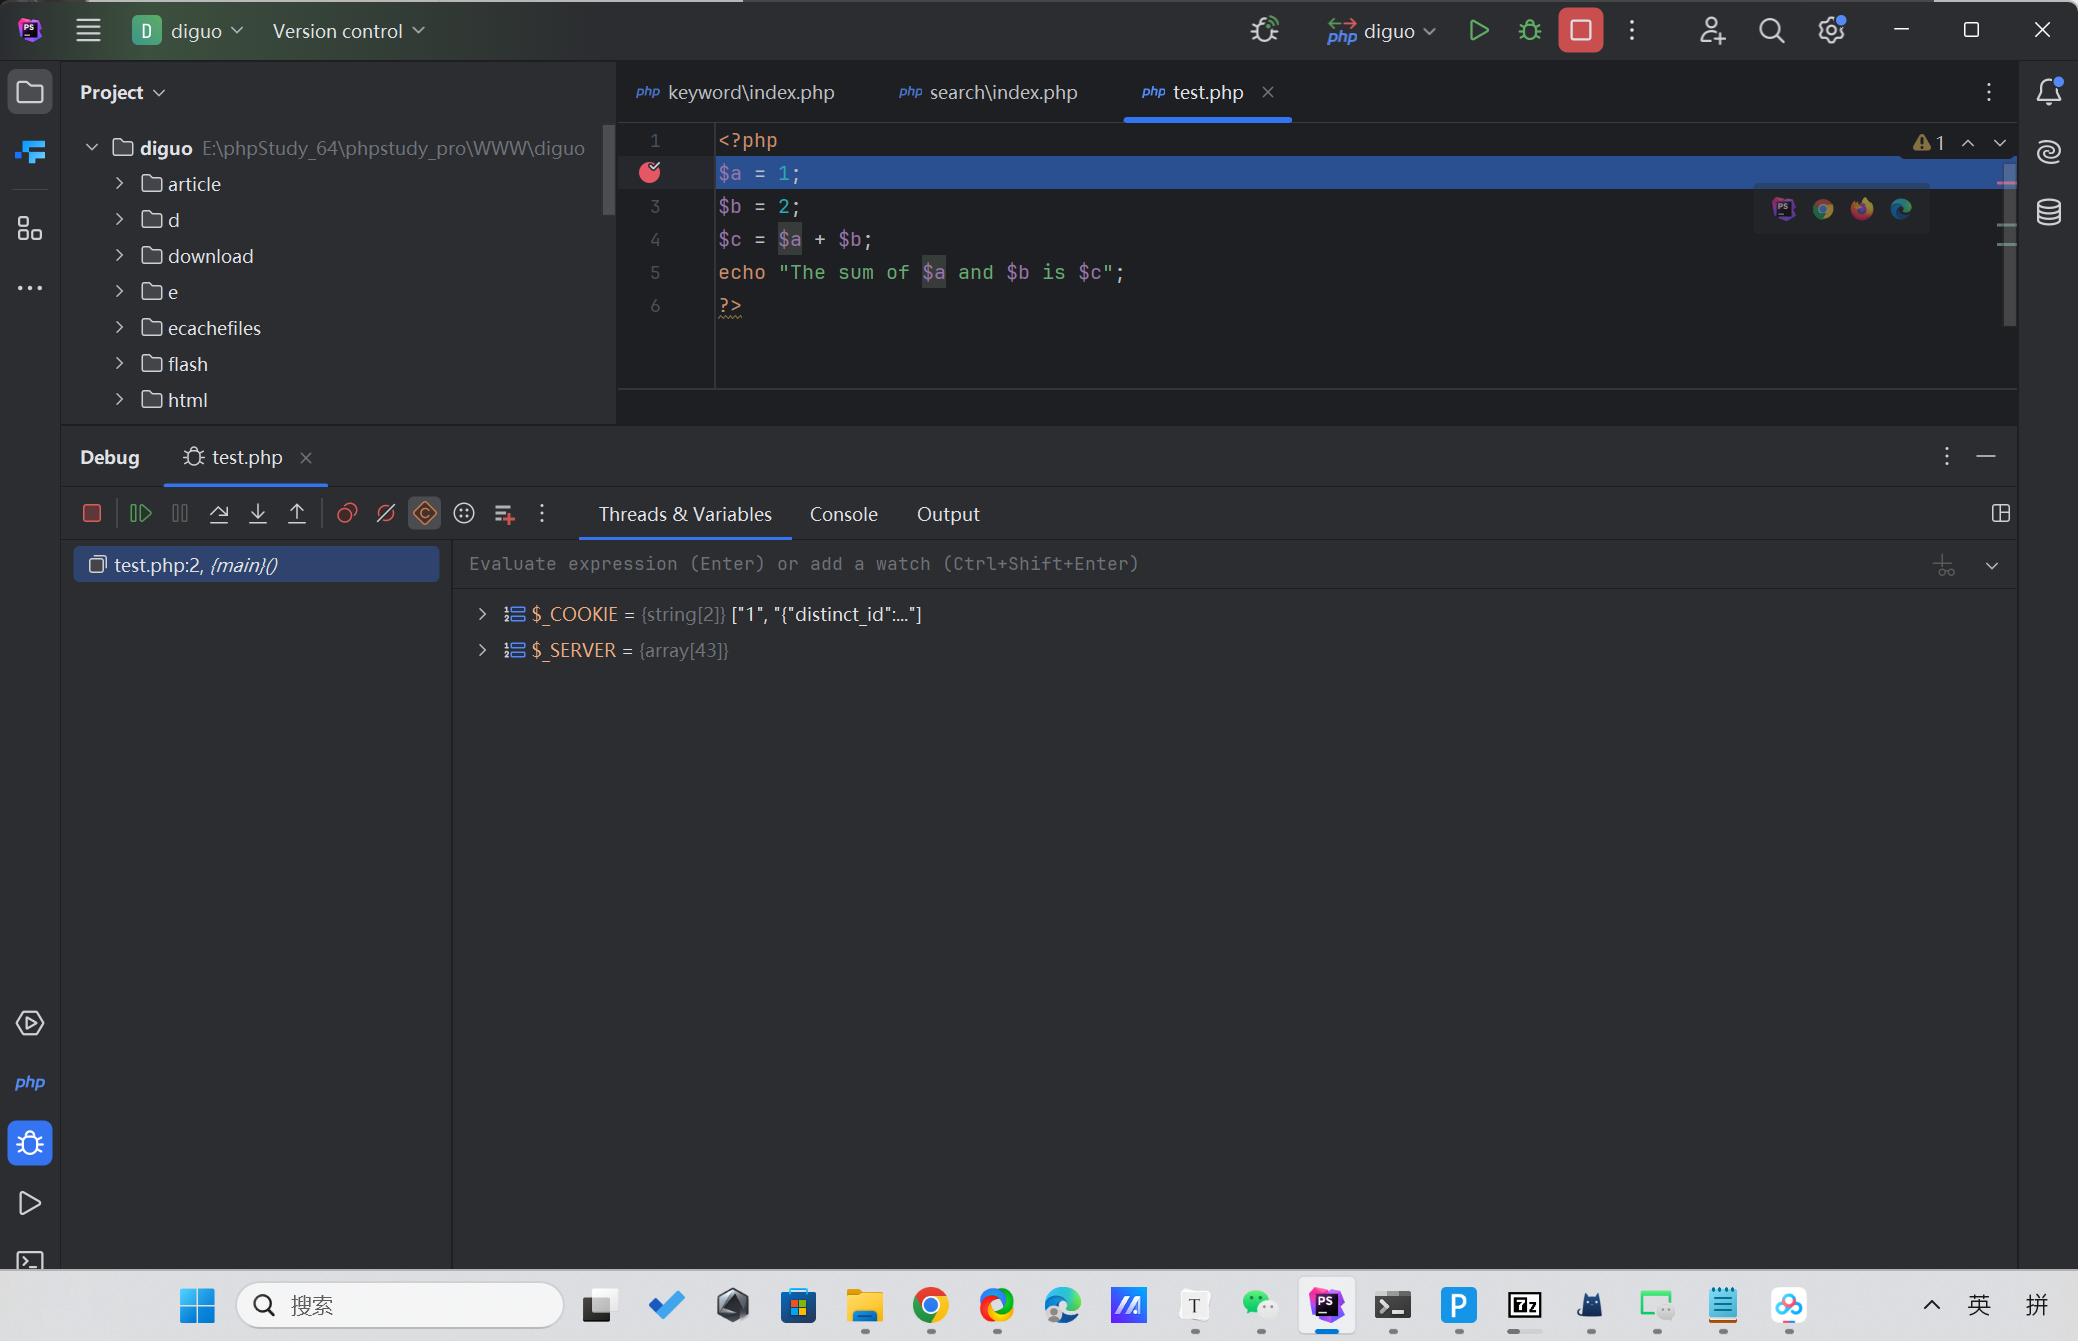
运行调试测试
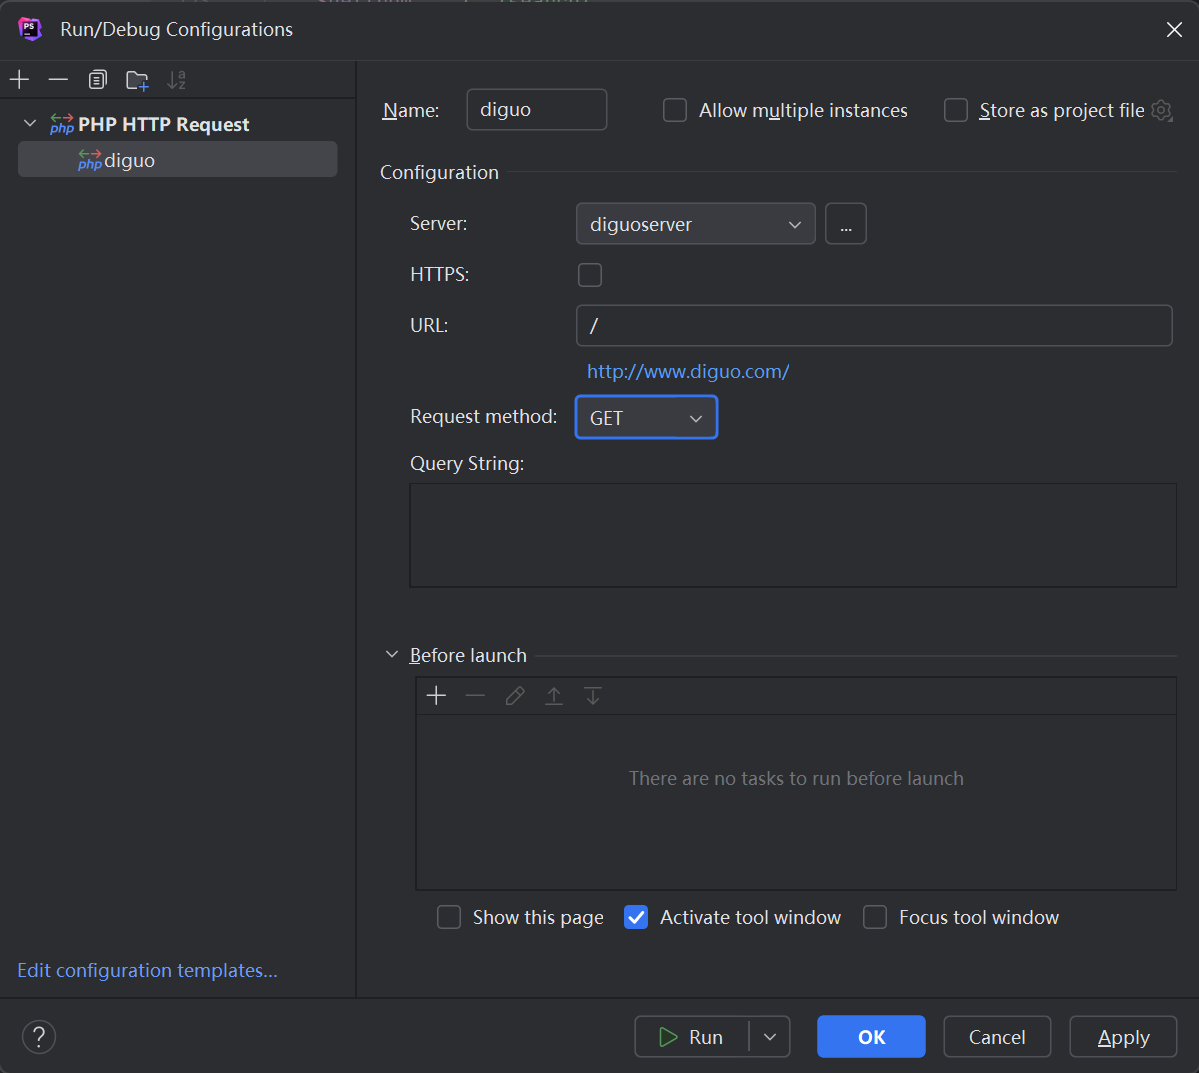
新建PHP HTTP Request调试
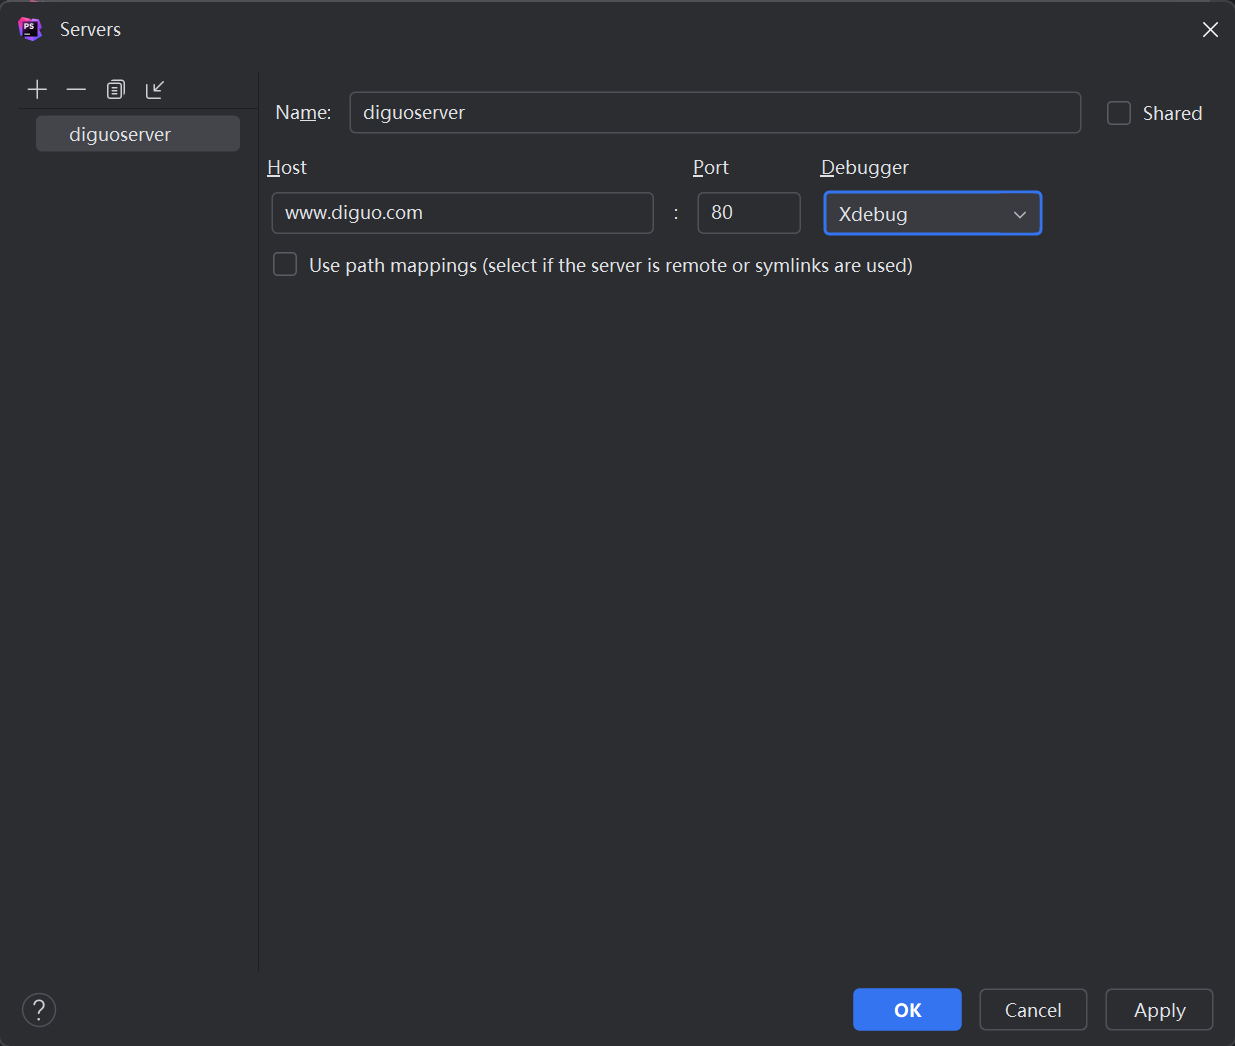
server配置
下断点打开监听
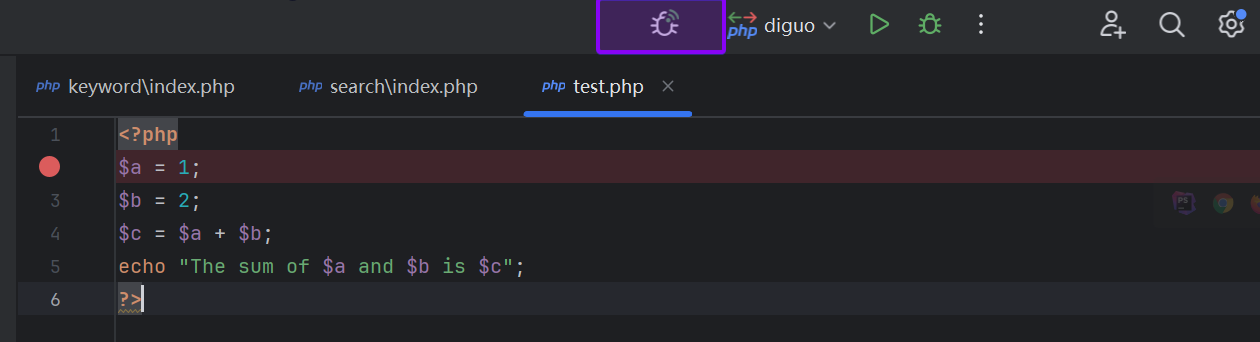
直接访问test.php,成功进入断点
__END__